This is the Capstone project I’ve done for the learning of IBM Data Science. I had great fun in the field of data science and applying them to the research topic that I’m interested in!
Education is a global issue that concerns all family across different countries and time span. Parents always put the investment in children’s education in the top of the list. It is so important that almost every country has the compulsory education policy which is usually between 9 to 12 years, throughout primary, middle and high schools. In order to carry out this compulsory obligation of their citizens, governments use the school districts to assign children to schools within each of the districts. However, considering the unevenly distributed socio-economic status of communities, there are usually good school district which parents are more inclined to send their kids to.
The Problem
There are lots of studies regarding children’s education, from recognition to development, to the extent how the quality of education would effect the achievement in the future. This study focuses on the education resources that can be adequately accessed by the neighborhoods. This study uses neighborhoods in Taipei City, Taiwan as a case study to examine if a gap exists among neighborhoods, regarding the accessibility to education resources.
Who may be interested?
The Government
Schools and libraries are important infrastructures that governments set up a budget for. However, it is difficult to measure the return on this investment, that is, the social benefit (in contrary to financial benefits) of schools and libraries, or where the government should put more resources. This study provides an example of good reference about where needs more attention from the government.
The parents
Many family would select a good spot to live in, and accessibility to education resources is always one of the most important feature when making such decision.
Quick facts about Taipei City, Taiwan
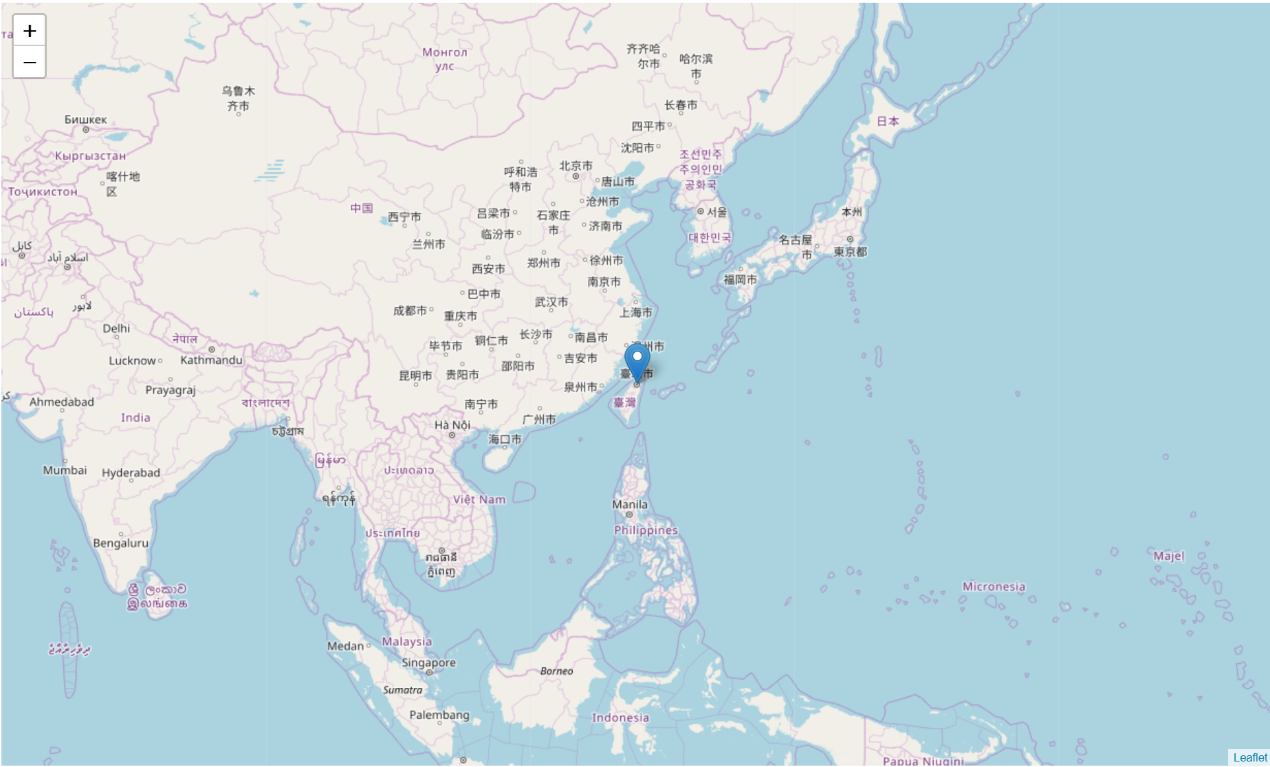
Taipei locates in East Asia and is the political and social-economic capital of Taiwan, where the Taiwan Government resides. Taipei City has a land area of 271.8 square kilometers (about the same size as Orlando, Florida), population of 2.6 million (close to the figure of Chicago), and a population density almost the same as New York City. The GDP (PPP) of Taipei City is estimated to be $300 billion, slightly higher than Atlanta, GA.
Chinese Mandarin is the official language, which is why in the rest of this study you will see Chinese characters, which this study will try to convert into English for better reading.
The old town of Taipei City was built in the end of 19th century, locating at southwestern side of current Taipei City. It is also where the Taipei Main Station locates. In this study you will see the old town is where most education resources are at.
METHODOLOGY
This study will collect the data of accessible education resources of each neighborhood in Taipei. By using K-means clustering, this study will divide the neighborhoods into 5 clusters and identify the cluster(s) which has a relatively weak accessibility to education.
The study will be carried out as follows:
1. Study of accessible education resources
This section will directly use K-means clustering on accessible education resources of each neighborhoods. The result will be a geometrical distribution of the clusters.
2. Study of accessible education resources per capita
The allocation of resources should take the population who will receive them into consideration. A more densed neighborhood should enjoy more resources. Following previous section, this section will calculate the accessible education resources per capita and remake the clustering model. The result should show where the per capita resources are distributed.
3. Study of accessible education resources per capita, taking socio-economic status into consideration
Some wealthier communities don’t necessarily locate in the central part of the city. However this doesn’t mean that kids from that community would have less access to education. Given that this study is aiming at providing a reference for policy making in regards of the allocation of education resources, the socio-economically weaker neighborhoods should be taken into account and given a priority in the resources. In this section both socio-economic status and education resources will be used as variables to run the K-means clustering model, in order to identify the neighborhoods in need of the most help, that is, where the government budget could have the best return of social benefit.
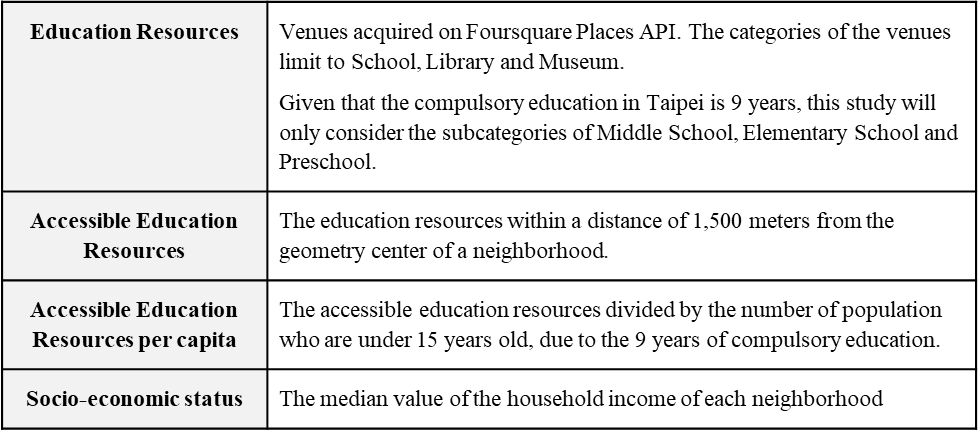
OPERATIONAL DEFINITION OF TERMS
DATA ACQUISITION AND CLEANING
GeoJSON of Taipei Neighborhoods and Their Geometric Centers
This study needs a map containing all neighborhoods’ coordinates to work on. Unfortunately such ready-for-use information couldn’t be found during the study. However, there are a few GeoJSON and Shapely file of Taipei City. After searching and comparing different accuracy rate of GeoJSON files, this study uses the GeoJSON file of Taipei contributed by littlebtc, as the infrastructure which this study will be constructed upon. Using GeoJSON instead of the coordinates also brings the benefits of better visualization effect on the map.
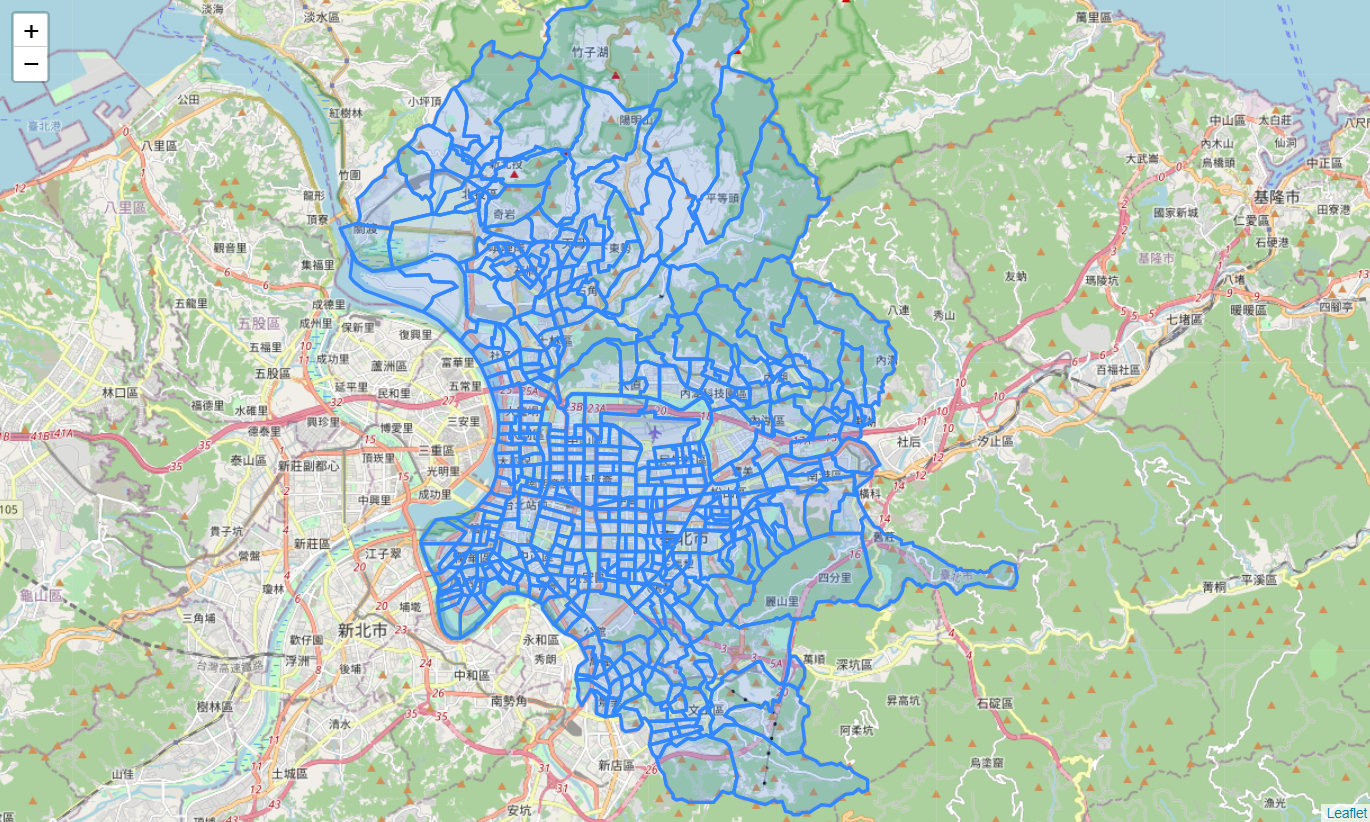
The next task is to calculate the geometric center of each neighborhood polygon within the GeoJSON file, which I will use as the reference point to explore venues on Foursquare.
Though there are a few libraries working on different calculation of polygons, it seems that they are not created for GeoJSON. Thanks to brandonxiang who created a super useful project geojson-python-utils that solves the problem. With the centroid function, I can check these neighborhoods on the map.
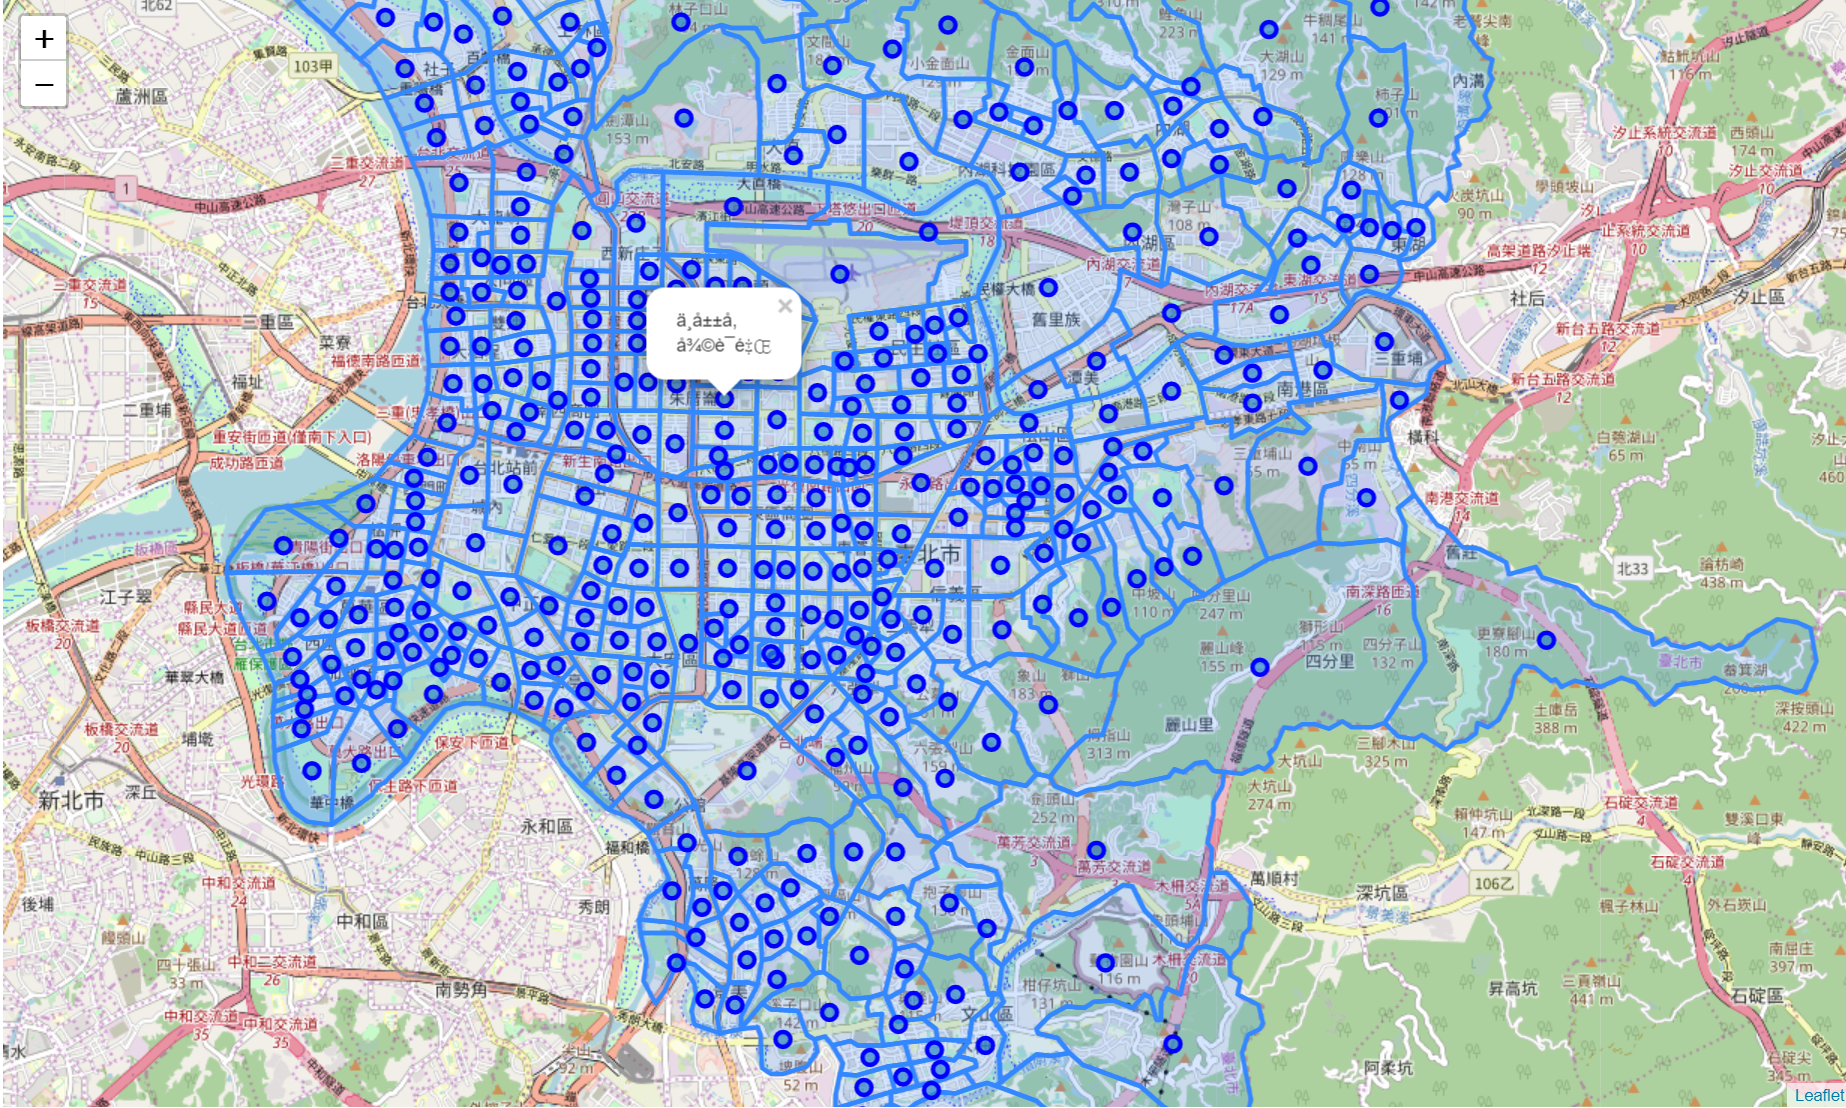
It appears that the Chinese characters cannot popup properly on the folium map, and not too many discussion covers the encoding issues like this. Thanks to Yafei’s Blog who solves this issue by bypassing it with html popups.
Taipei Household Income and Population under 15
The statistics data is collected from the government website and stored on github for use.
The household income data is read from an excel file. Some of the titles of columns are renamed for future use, where “dist” and “neigh” represent district and neighborhood respectively. The population data was separated by ages and sex. A new column “under_15” is created to store the sum of the population. The two dataframes are then merged with the GeoJSON dataframe which contains the coordinates of all neighborhoods.
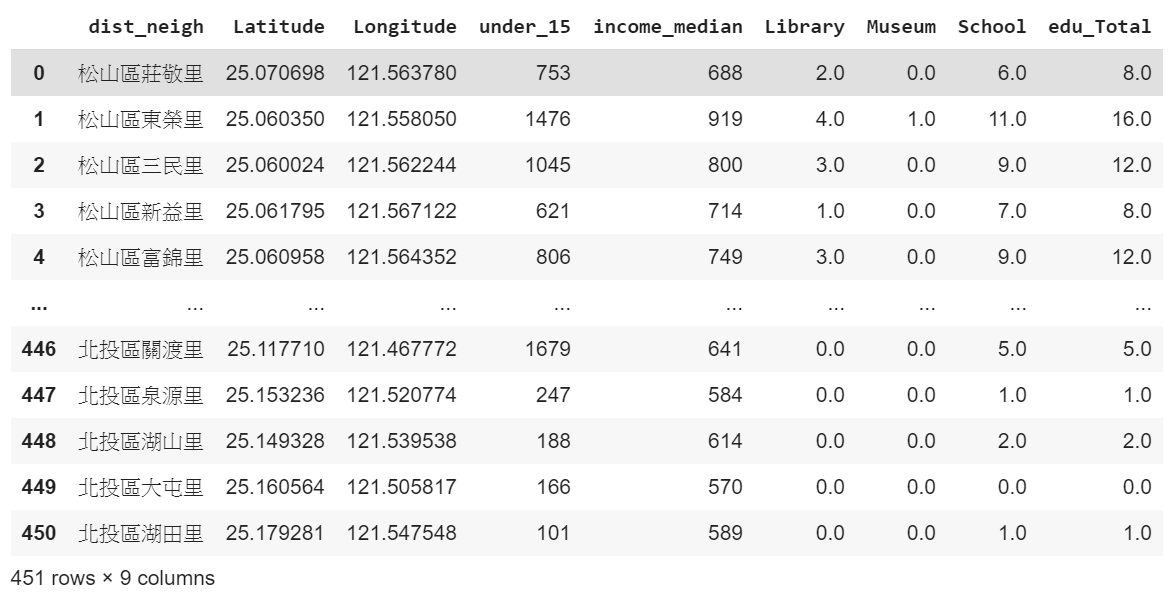
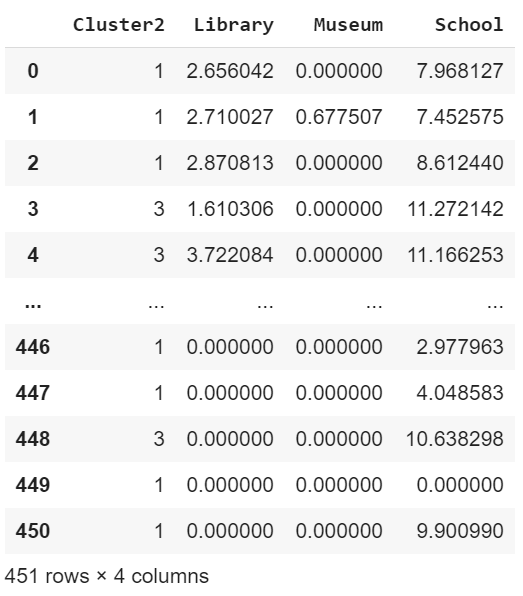
The table shows the required information for later study, where dist_neigh, under_15 and income_median represent the neighborhood, population under 15, and the median value of household income.
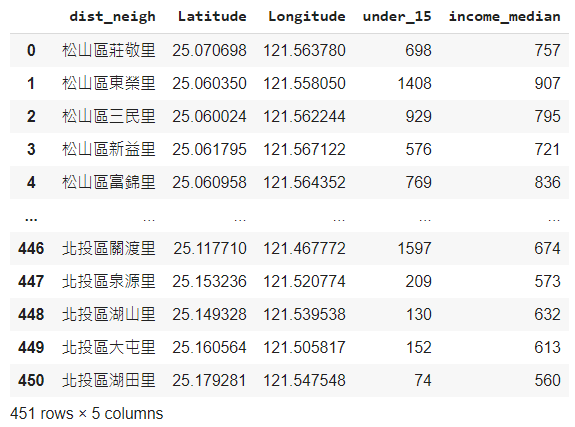
When comparing with the original GeoJSON data where there are 456 neighborhoods, the new dataframe contains only 451. The five missing neighborhoods could be because of the lack of the socio-economic data, change of administration neighborhoods or any other reasons, which is beyond the scope of this study.
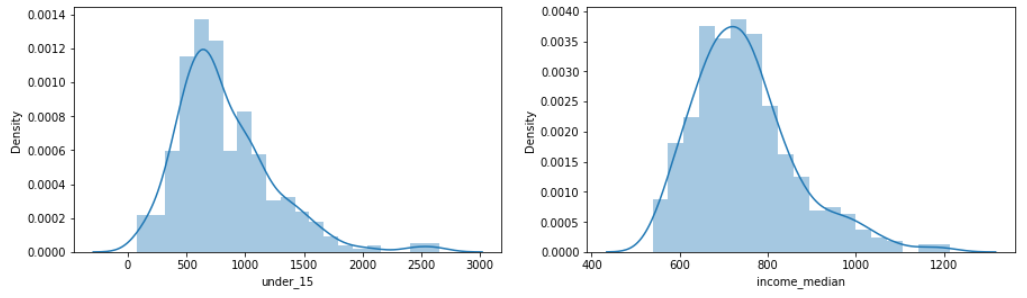
Quickly checking the distribution of the population and household income of the neighborhoods, both figures show right-skewed distribution, meaning that they have longer tails to the right. In such case median instead of mean value could usually be a better choice to represent the group.
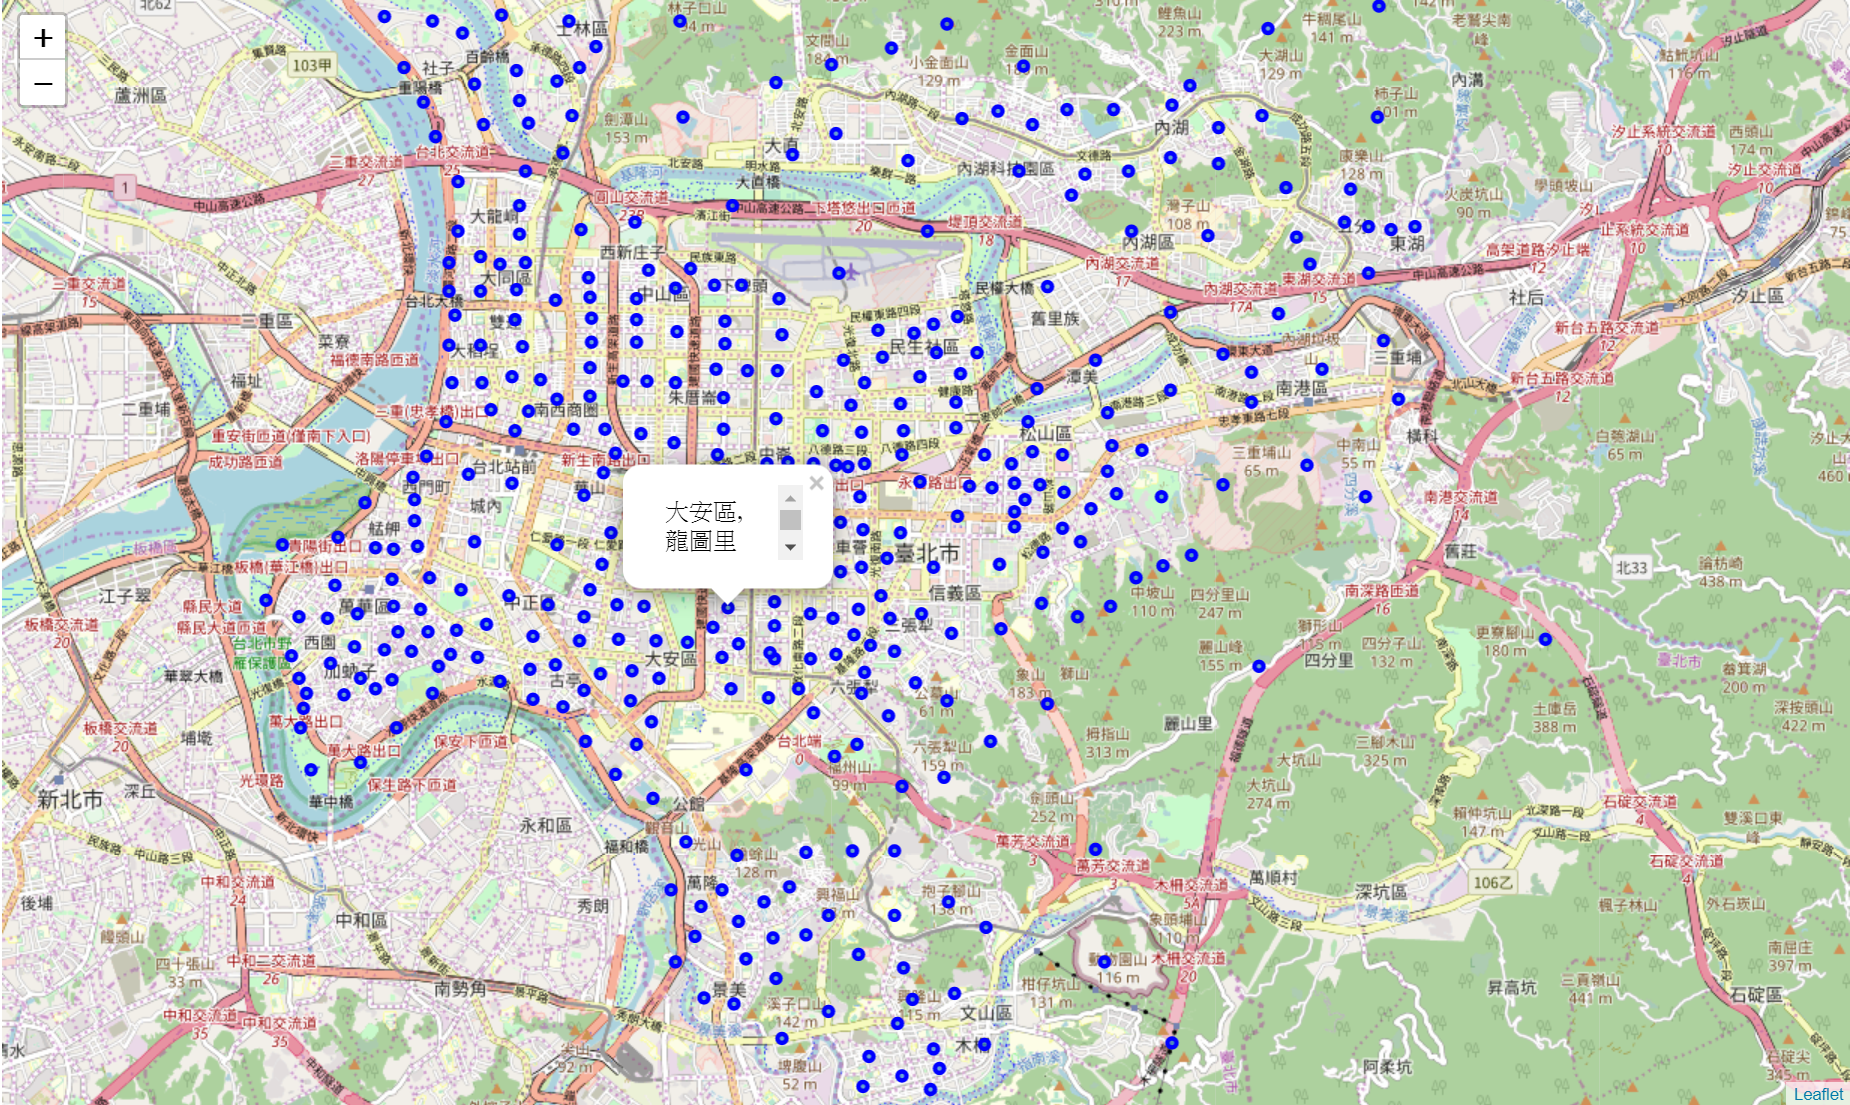
Below figures show how the neighborhoods distributed geometrically. The upper one shows the distribution of household income while the other shows population of under 15.
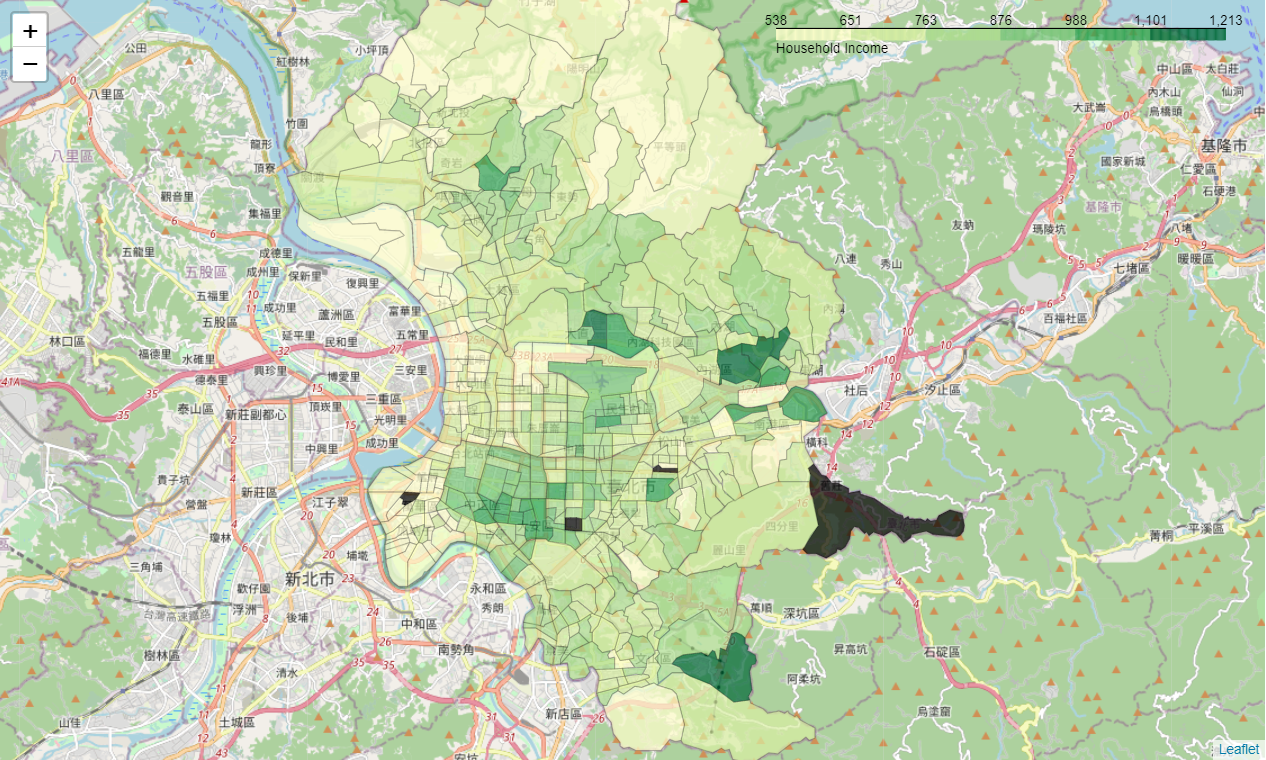
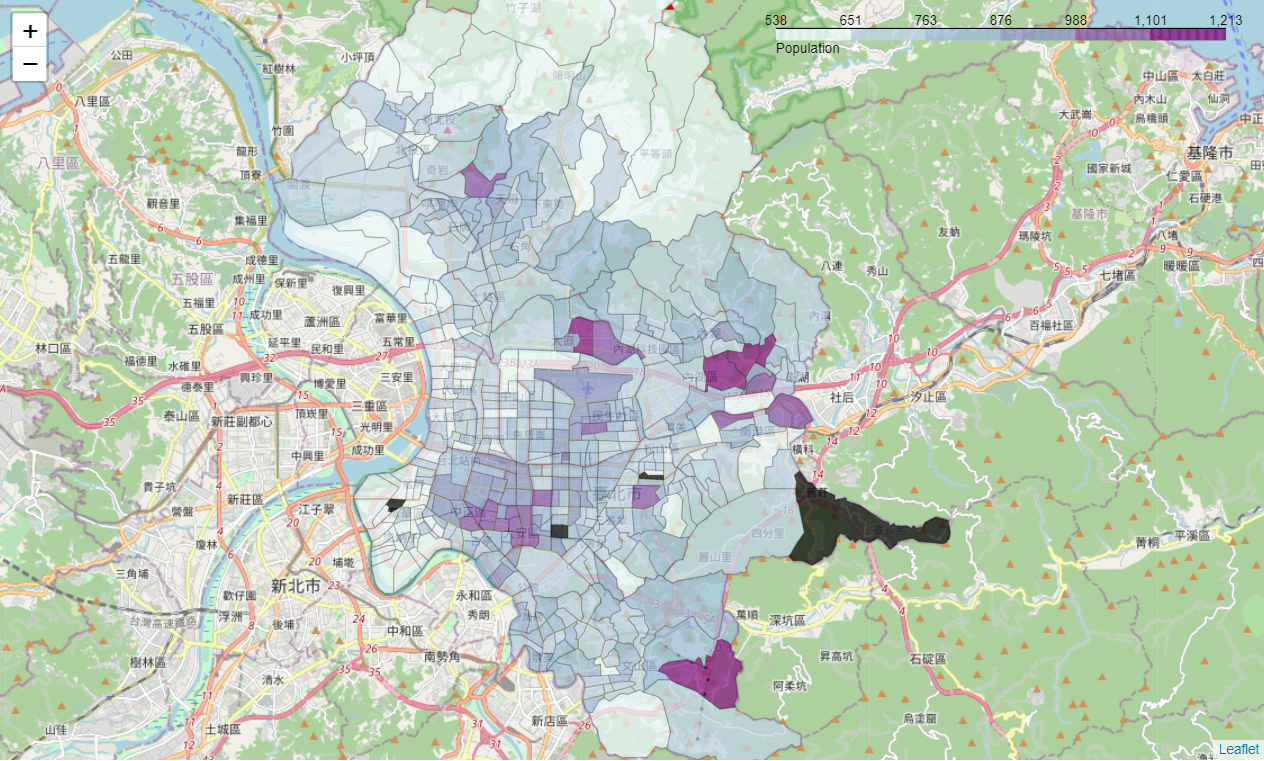
When visualizing the data on map, it’s hard not to notice that how similar these two figures are. Is it possible that household income and population under 15 are correlated for an unknown reason? Does wealthier family tend to have more kids than others? These topics are certainly deserved a more careful look in the future.
Education Resources by Foursquare
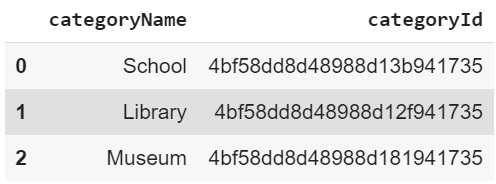
To get to know what categories of venues we can find on Foursquares, first this study pulls out the entire categories list provided by Foursquare. However, it’s not very easy to understand even if we convert the list to a dataframe because of its hierarchical structure.
I turned out to directly scrap it on Foursqaure webpage of Venues Categories, and find “Museum” subcategory under “Arts & Entertainment”, and “School” and “Library” under “Professional & Other Places”. These category IDs are then used to get the list of accessible education resources of each neighborhood, where more than 9,000 venues are successfully retrieved.
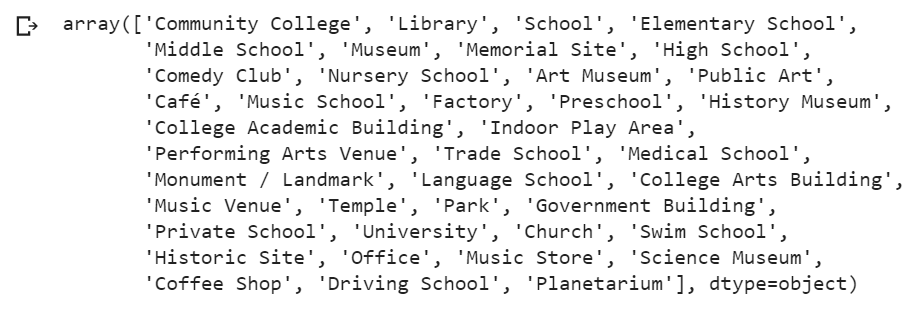
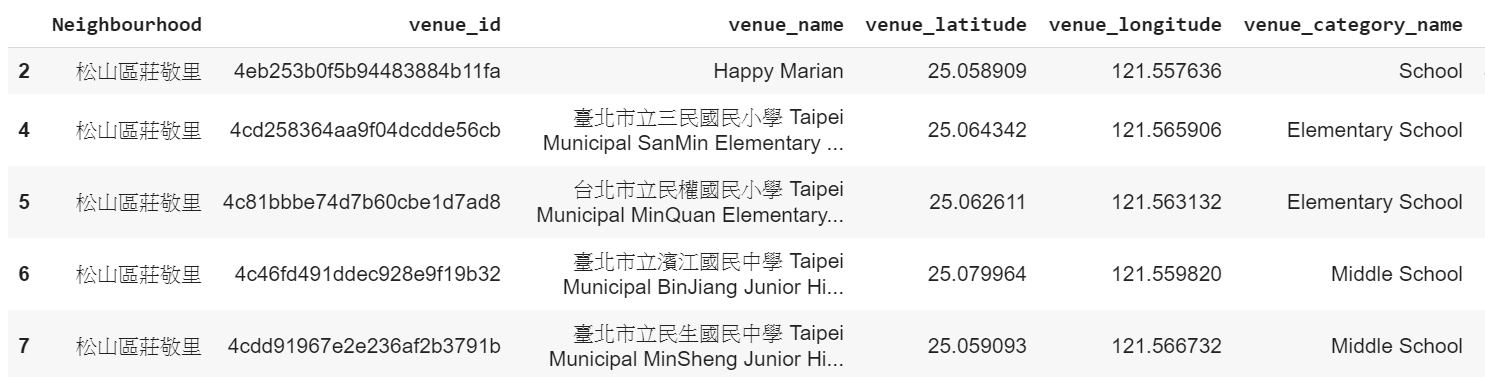
However the results still show a wide range of categories where many of them should not be identified as education resources (Figure 8). This study narrows down the category “School” to only include School, Elementary School, Middle School and Preschool, and “Museum” to all related kinds of museums. The list is significantly cut down by 2000 to 7225 venues.
Checking on how the neighborhoods access the education resources, one can easily find that the top 5 neighborhoods which have the most accessible resources are all in the old town, the southwestern part of Taipei City, while the last five are located in outer area.
However, there are 5 neighborhoods missing due to that they have zero access to education. These neighborhoods have been brought back by setting the numbers to zero, for later analysis.
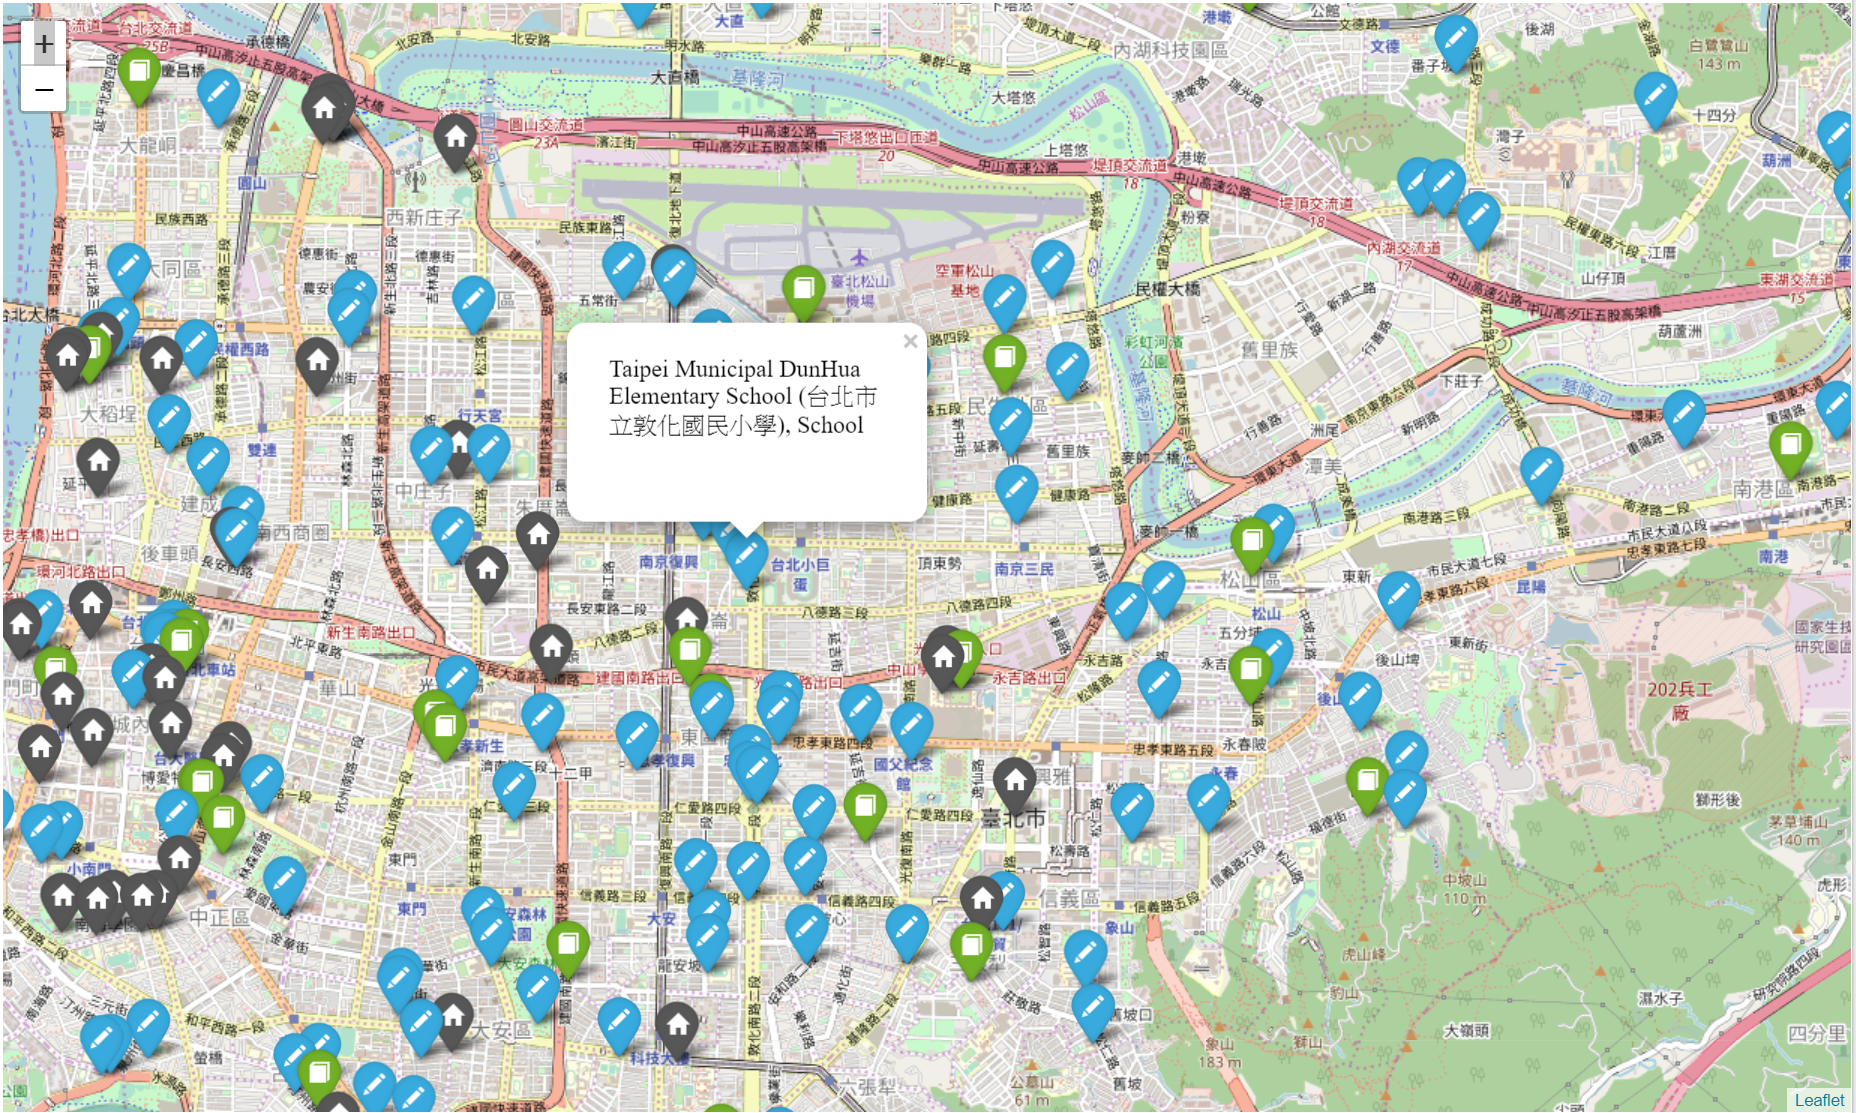
Check the unique venues and where they locate
There are more than 7,000 venues in the list, where most of them are duplicated simply because of the area covered by the radius of 1,500 meters. The search results are refined by removing duplicates and find 333 unique venues, of which 310 are located within only 204 neighborhoods in Taipei City.
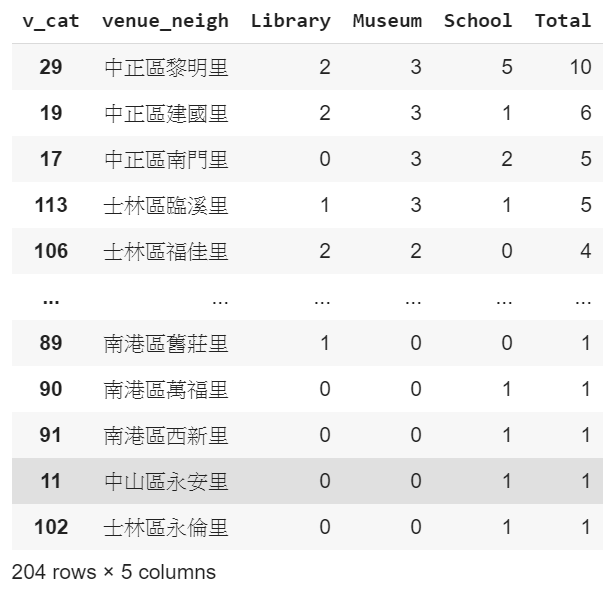
It’s not surprising that more than half neighborhoods have no education resources given that the land area of neighborhoods could be very small inside the old town.
RESULTS
1. Clusters of Accessible Education Resources
This study uses K-means clustering to run the numbers of accessible education resources for all neighborhoods. The K values is set as 5 due to the general practice for socio-economic studies such as Gini coefficient to analyze the top and bottom 20%.
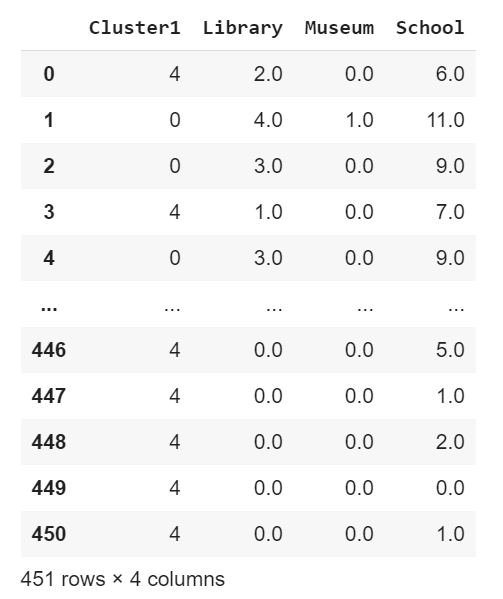
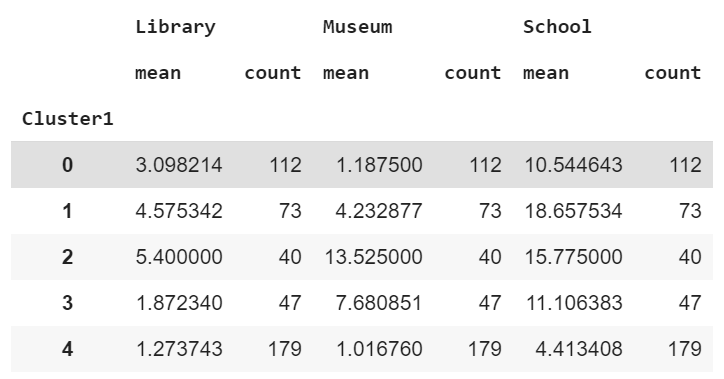
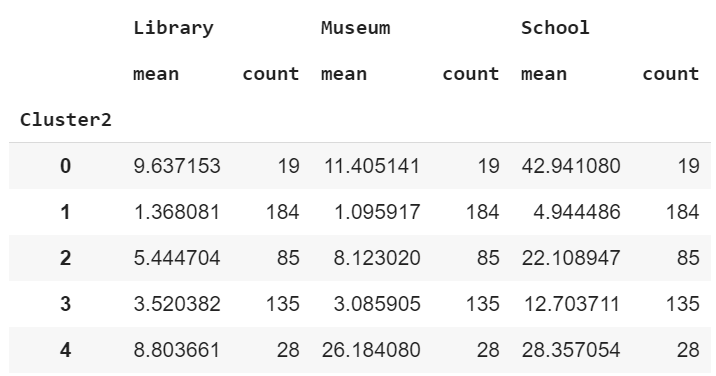
Below table shows the results of clustering. It seems that the number of each cluster doesn’t exist some kind of ranking. That is, Cluster 1 is not necessarily better or worse than Cluster 0. While Cluster 1 has the most school, Cluster 2 should be the best one given that it has all kinds of resources. Meanwhile Cluster 4 has the least resources among the clusters.
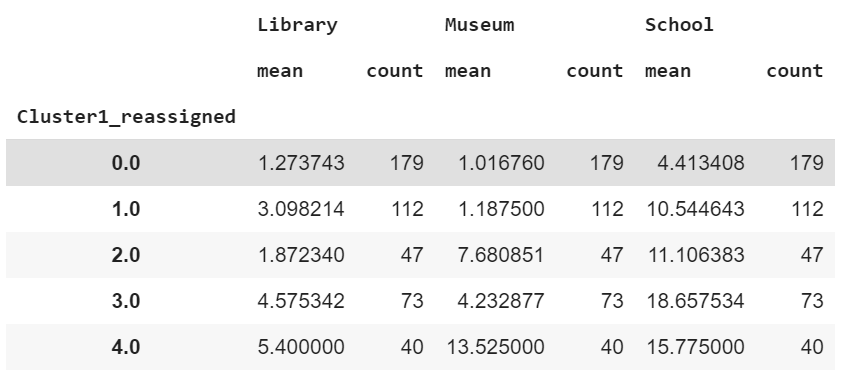
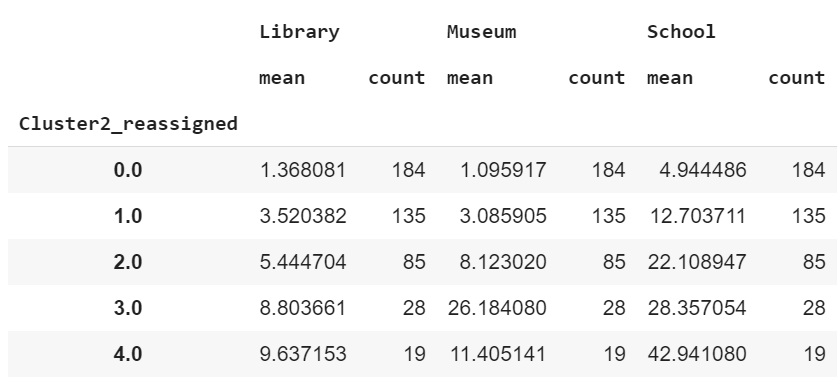
Taking a careful consideration of mean value of each variable, this study reassign the cluster in an ascending order where Cluster 4 is the best one. By doing this helps the visualization on map where the audience will find the result is much easier to understand.
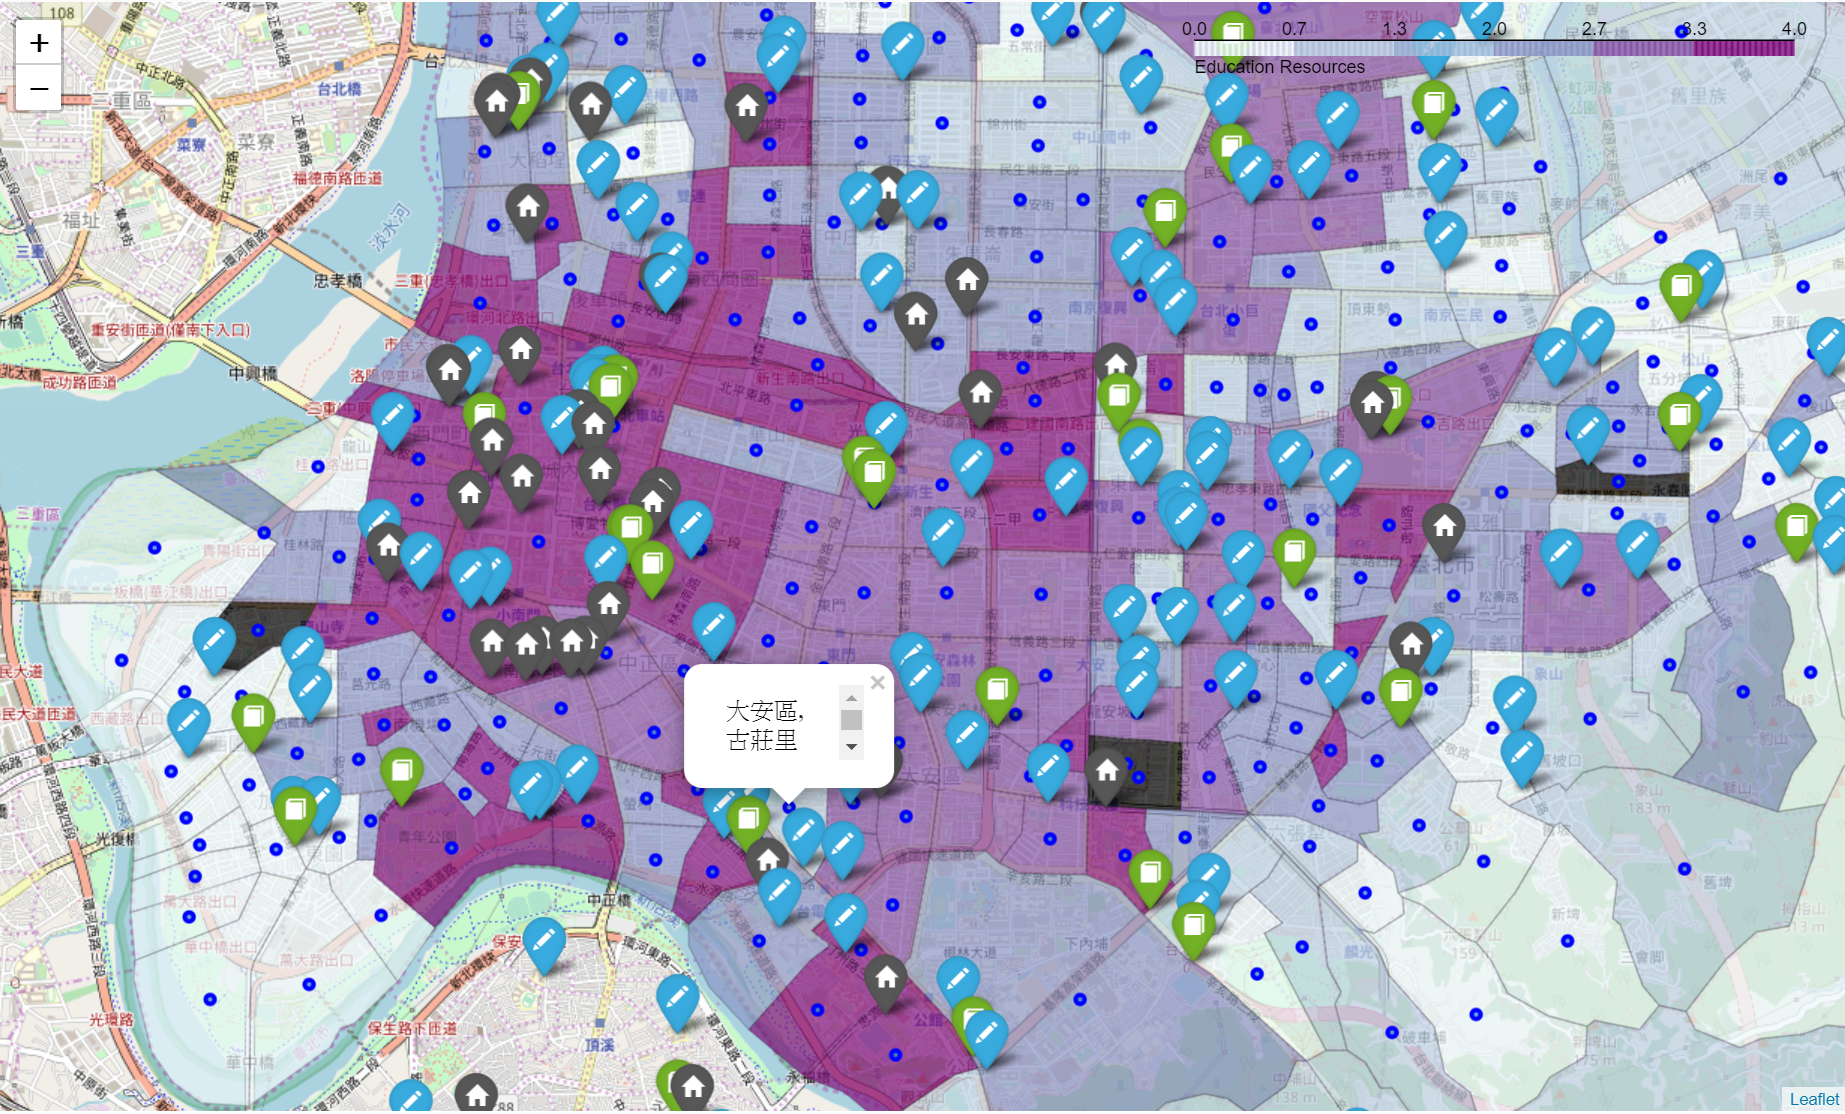
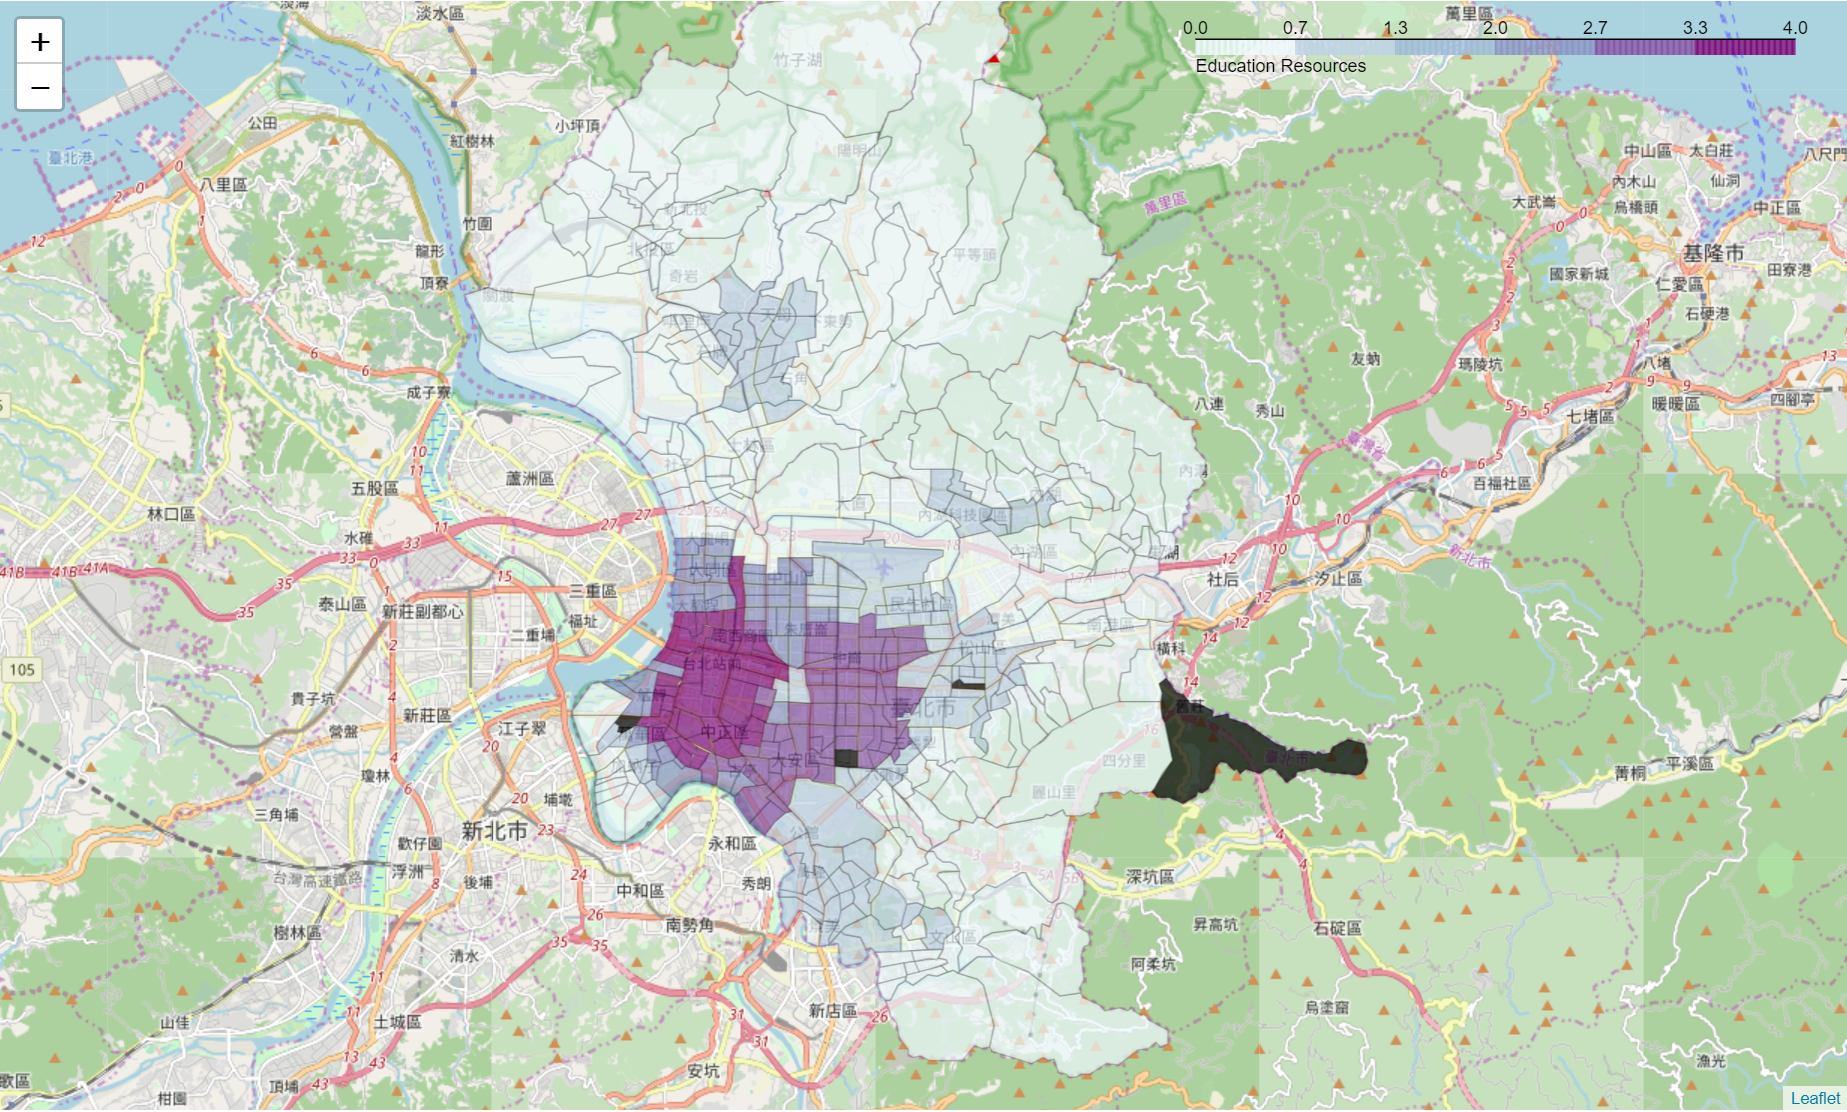
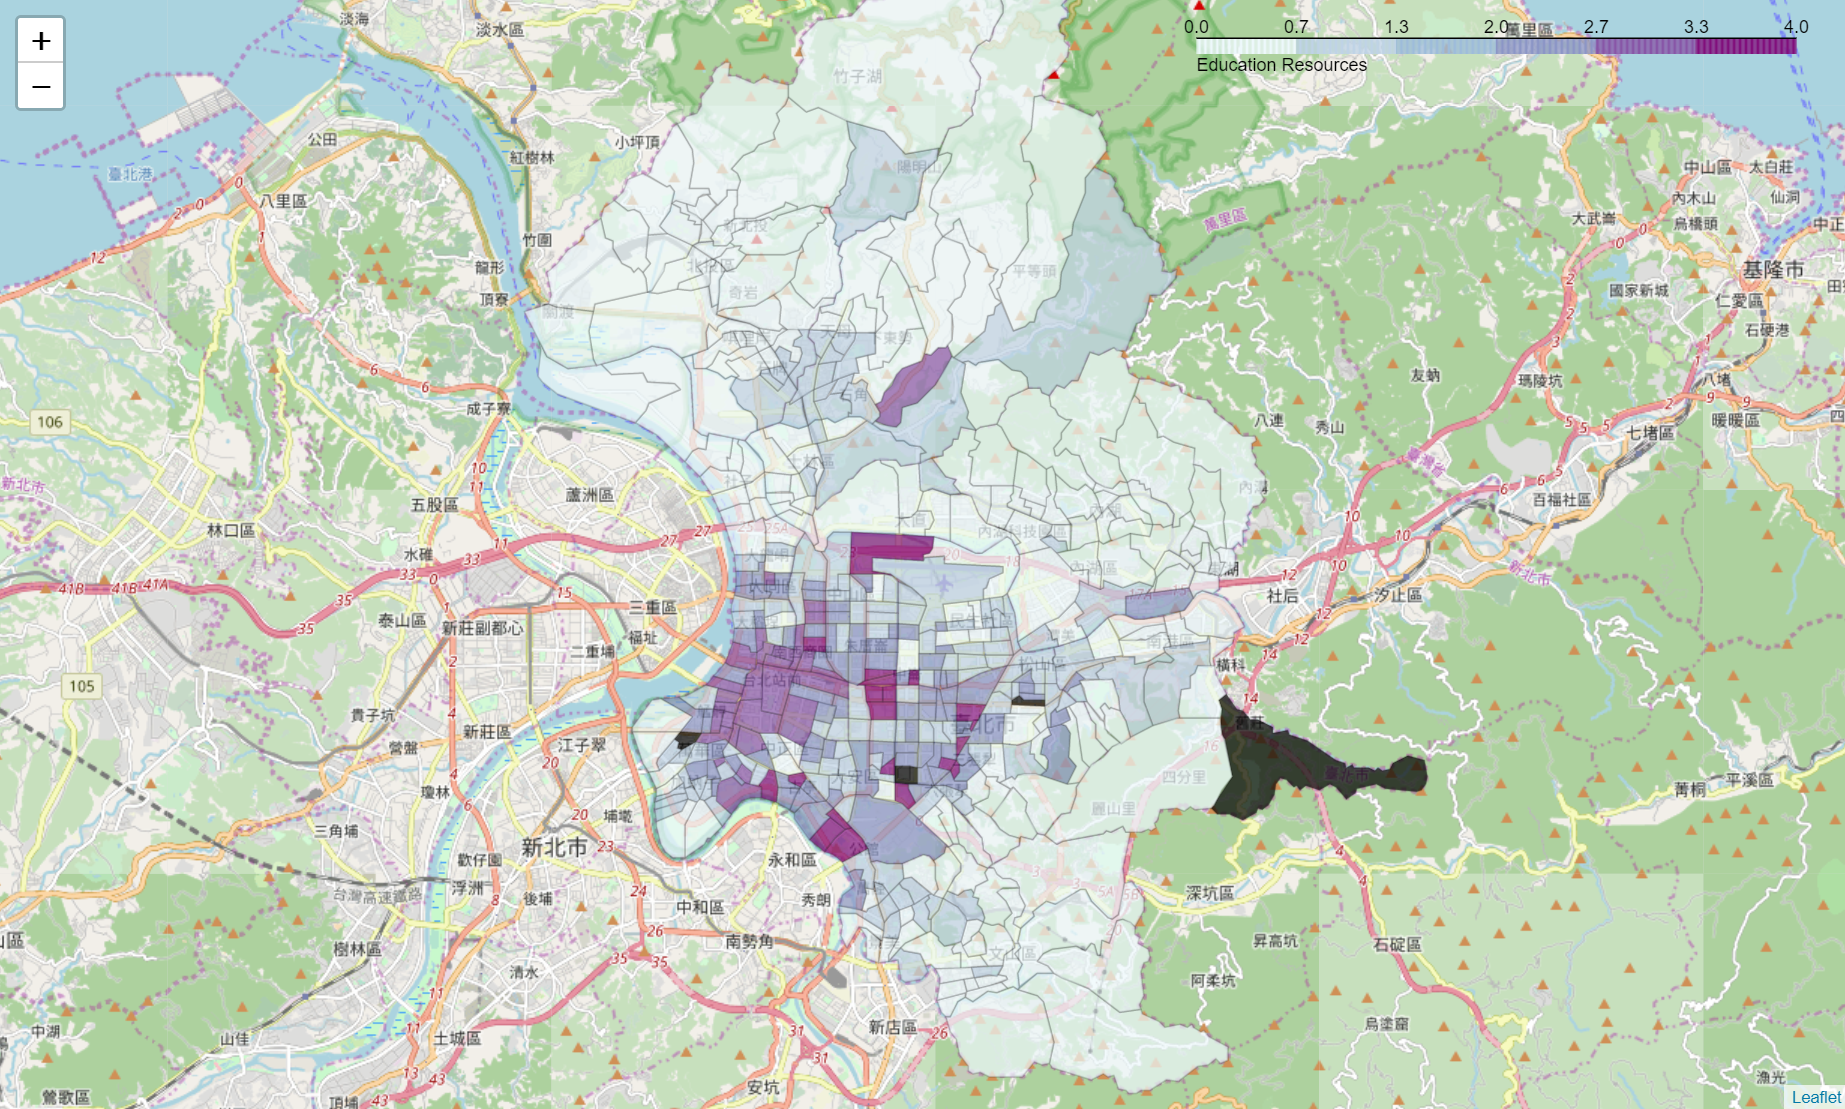
Showing the reassigned clusters on the map, one can easily see that the neighborhoods with the best accessibility to education resources are concentrated in southwestern part of Taipei City, which is the old town.
2. Clusters of Accessible Education Resources Per Capita Under 15
Previous section shows an unevenly distribution of education resources in Taipei City. However, one should understand that more resources would be allocated to highly populated area to achieve higher social benefits.This section further analyses the per-capita education resources and make new clusters based on them.
Below table shows the accessible education resources per thousand capita under 15 and the cluster number. Cluster 0 and 4 are closely tied to each other in terms of total per capita resources. While Cluster 0 has far more schools (per capita), Cluster 4 has good numbers of both schools and museums. It is hard to say that which education resources, School or Museum, should have higher weight to provide a new ranking.
This study reassigns the clusters by the total numbers of resources. Below table and figure show the results of distribution. One can see that while the original Cluster 0 (with the most School) are distributed in discrete area, original Cluster 4 still tends to concentrate in the old town area where lots of museum locate.
3. Clusters of Accessible Education Resources Per Capita, Taking Socio-economic Status into Consideration
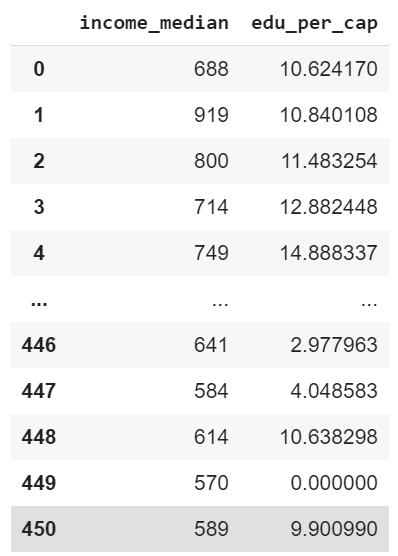
Finally, this study takes socio-economic data into consideration. In order to simplify the question regarding whether resources of different categories should be given different weights, this study uses the total accessible education resources per 1000 capita as one variable. The median of household income is the other variable (showing below). The scale of two variables differs a lot so the data is normalized before running the K-means clustering model.
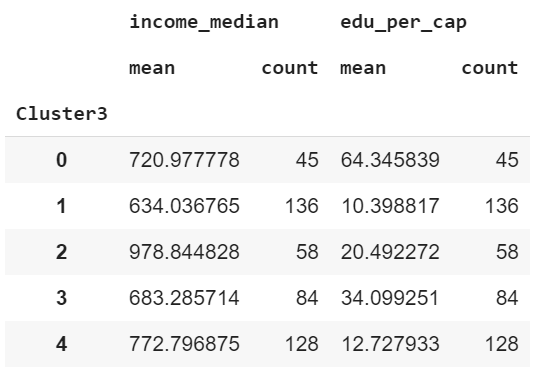
Below table shows the result of the clustering, which is hard to tell if a ranking exists for comparison. This study then reassigns the clusters based on the normalized sum of the two variables and creates new clusters.
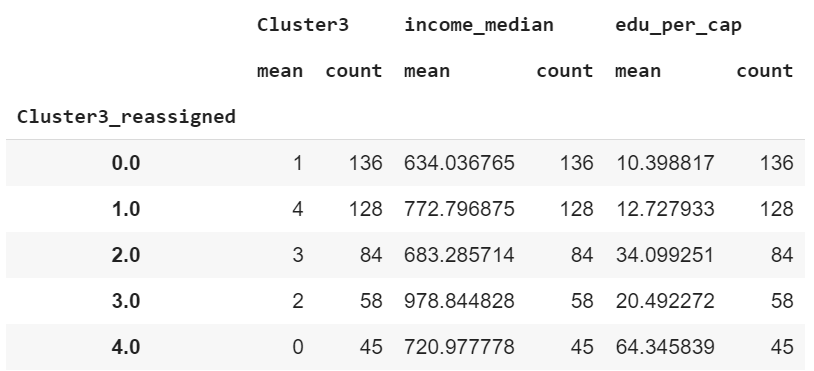
We can see from Table 14 about how income effects the clusters of distribution. The two clusters (reassigned Cluster 3 and 1) that have highest income only rank third and fourth place in the numbers of education resources, while the cluster with highest education resources takes the third place in household income.
It is notable that the reassigned Cluster 0 have both the lowest income and education resources.
We can also use the previous created venue list to find out how these education resources interact with the clusters.
DISCUSSION
The neighborhoods from the old town have more accessible education resources
The neighborhoods with higher accessibility to education resources concentrate in the southwestern part of Taipei City, which is the “old town” with the longest development history. It’s not surprising that most education resources are located in the oldest area of a city.
Except the core area, there are three areas that needs further attention. “Tianmu”, located in northern part of Taipei, is where Taipei American School and Taipei Japanese School are at. It is also the place where many foreigners live since after World War II. “Neihu” locates in the geometric central part of Taipei while “Nangang” in central east part. These three areas have both higher household income and under-15 population, which have an impact on the analysis.
Some highly populated neighborhoods from the old town show weaker per capita accessibility
We see the distribution of accessibility has shifted when it comes to per capita numbers. Not every neighborhoods in the old town enjoy the same level of per capita accessibility. A bunch of high populated neighborhoods share a limited number, though still higher than other places, of resources, while some outer neighborhoods could benefit from a higher quality of education.
Meanwhile, please note that the top 2 cluster have almost the same amount of per capita resources. They are separated into to different clusters because of the strength in different type of education resources. Cluster 4 (deepest color) has significantly higher number of schools than other, and Cluster 3 has the most museums. As we can see neighborhoods in Cluster 4 are scattered in a wider area, those in Cluster 3 still concentrate in the old town.
Considering socio-economic status, some outer neighborhoods show greater accessibility
There are wealthier communities located in outer part of Taipei City. Though there may not exist too many education resources, however, one should take this situation into consideration especially when allocating the government budget for future investment. Certainly we’d like to see the money from the taxpayer can be used more wisely on projects that create the highest social benefit.
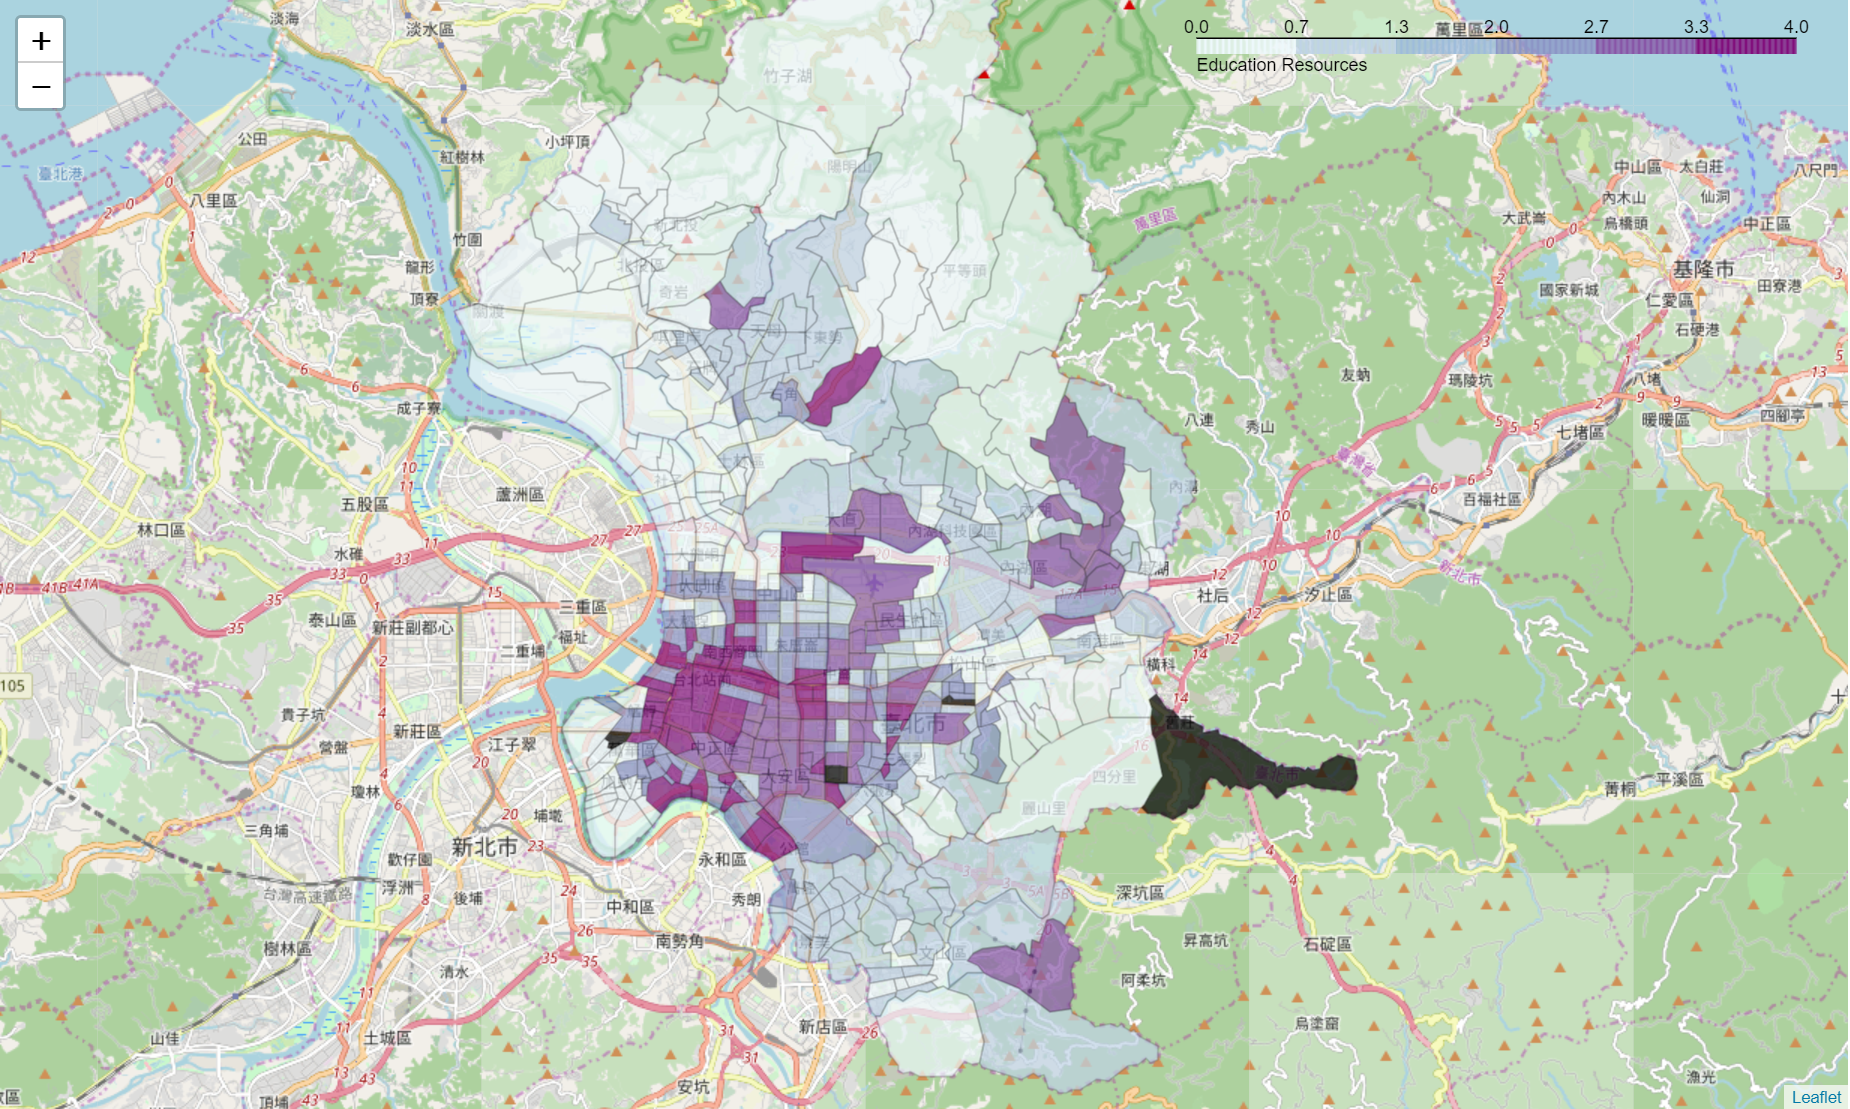
Table 14 shows that while Cluster 4 has the highest accessibility, its income only rank the 3rd place. In the contrary, the wealthiest Cluster (Cluster 3) also takes the 3rd place in accessible education resources. Shown in Figure 11, now we can see “Tianmu”, “Neihu” and “Nangang” stand out when we consider both education and income as variables. These relatively wealthier areas may not demand resources as urgent as Cluster 0, which has both the lowest income and accessibility to education resources.
LIMITATION OF THIS STUDY
The measurement of accessibility is difficult and arbitrary
This study use the distance between venues and the geometric centers of the neighborhood polygons to define the “accessible” education resources. This convenient approach has at least two limitation that need further attention in future studies:
It neglects the distribution of the population. For example, a neighborhood near the waterfront could have its geometric center in the middle of the river. While a big neighborhood could find no venues at all within the radius of 1,500 meters.
It doesn’t consider the option of using transportation. There are great public transportation in Taipei City include MRT (the subway), a network of bus routes covering a great area, and even youBike (a bike sharing system). With the help of transportation, the accessibility should be re-define as a combined function of time and cost for using it. Much more resources could be reached by neighborhoods that besides a subway station, which can completely the clustering results.
Different weights should be assigned to education resources
This study doesn’t take a careful look at the venues themselves but only the categories that Foursqaure assigns to. This could create issues in different ways:
The weights between different categories: Should different categories have the same weight? Can a community library from 1,200 meters away have the same impact on an 8-year-old kid as does the elementary school from 100 meters?
The weights within the same category: Should National Palace Museum, which has a permanent collection of nearly 700,000 pieces of ancient Chinese imperial artifacts and artworks, share the same weight as an art gallery that displays private collections?
CONCLUSION
Starting from the care of education, this study aims at providing a solid support for the government for the allocation its resources. By giving a definition to the terms, collecting and cleaning the data, and applying the data into a machine learning model (K-means Clustering), this study successfully identifies the relatively strong and weak neighborhoods in accessibility to education resources. A cluster of weakest neighborhoods in both accessible resources and household income will need further attention for the government’s policy making. Furthermore, this study has its limitation which one should bear in mind during reading it. This limitation needs to be refined in future studies to provide more thorough findings.
SOURCE CODES
A full report and Notebook containing codes used in this study can be found on my GitHub.